
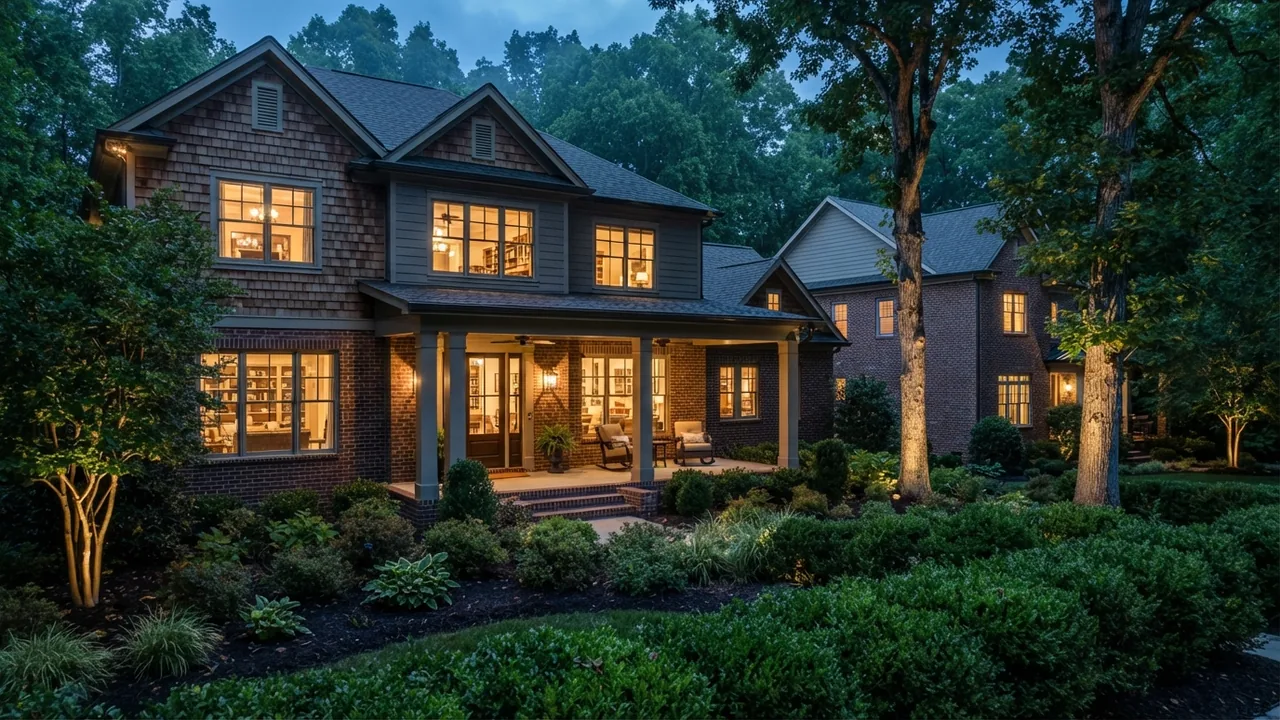
This is a dated snapshot. The figures below cover the 90 days ending October 1, 2026. For the current numbers, updated monthly, see the South Charlotte market data page.
If you have been waiting for South Charlotte prices to finally break, this month’s numbers will not hand you that. What they hand you instead is time. Across the 13 South Charlotte areas I track, 1,873 single family homes closed for a combined $1,349,879,354 in the 90 days ending October 1, 2026, an average sale price of $720,704 and a median of $575,000, per Canopy MLS. The median slipped 2.5 percent from last month’s window. Median days on market rose in 11 of the 13 areas.
That is the whole story in the South Charlotte housing market this month, and it is the one that matters if you are shopping. The market did not get much cheaper. It got slower, which is a different kind of opening and a better one for a buyer who is three months out and has not seen a house yet.
Every figure here is a closed sale recorded in Canopy MLS, the multiple listing service covering the Charlotte region. This is the fourth edition of a monthly series. Last month’s report is here, and the full archive lives in the market reports category.
8 min read | By Steve Jarrell, The Longleaf Group at eXp Realty | Updated October 2026
Free · 26-Page Insider Guide
Which South Charlotte town is right for you?
Towns compared, NC vs SC taxes and schools side by side, and the 5 mistakes out-of-state buyers make.
What This Guide Covers
- The October 2026 numbers, town by town
- What changed in South Charlotte since the September 2026 report
- The state line stopped being a discount
- The top of the market got thin: Weddington and Marvin
- SouthPark’s average is carrying three very large sales
- The value corridor is still the slowest market
- How to read these numbers
Read the table below for your town first, then read the section under it. A median price on its own will mislead you. The two columns that decide how your search or your sale actually goes are days on market and price per square foot, and this month both of them moved more than price did.
The October 2026 numbers, town by town
The Short Answer
South Charlotte closed 1,873 single family homes for $1.35 billion in the 90 days ending October 1, 2026, per Canopy MLS. Closings fell 13.2 percent from the prior window and homes took longer to sell in 11 of the 13 areas, while the median price eased 2.5 percent to $575,000.
Key numbers right now:
- 1,873 closed sales across the 13 tracked areas, 285 fewer than the prior window
- $575,000 median sale price, $720,704 average, $236.32 median price per square foot
- Priciest area: Weddington at a $1,500,000 median. Most affordable: Monroe at $400,000
- Fastest market: SouthPark at 10 median days on market. Slowest: Monroe at 37 days
- NC side: 1,452 sales, $568,535 median. SC side: 421 sales, $610,000 median
| Area | County, State | Closed sales (90 days) | Median sale price | Average sale price | Median days on market | Median price per square foot |
|---|---|---|---|---|---|---|
| Weddington | Union, NC | 35 | $1,500,000 | $1,611,676 | 12 | $328.99 |
| Marvin | Union, NC | 5 | Not published, sample too small | Not published | 35.5 | Not published |
| SouthPark (28210/28211) | Mecklenburg, NC | 202 | $806,500 | $1,113,641 | 10 | $367.63 |
| Lake Wylie | York, SC | 25 | $789,000 | $821,800 | 17 | $244.87 |
| Ballantyne (28277) | Mecklenburg, NC | 147 | $720,000 | $881,916 | 11.5 | $281.06 |
| Waxhaw | Union, NC | 261 | $686,500 | $839,382 | 21 | $231.95 |
| Fort Mill | York, SC | 329 | $600,000 | $682,328 | 27 | $231.01 |
| Matthews | Mecklenburg, NC | 203 | $575,000 | $645,790 | 14 | $234.95 |
| Indian Land | Lancaster, SC | 67 | $575,000 | $638,473 | 33 | $226.54 |
| Mint Hill | Mecklenburg, NC | 88 | $544,995 | $625,483 | 25 | $227.03 |
| Indian Trail | Union, NC | 195 | $502,023 | $520,716 | 22 | $193.77 |
| Pineville | Mecklenburg, NC | 42 | $491,250 | $493,363 | 13 | $235.43 |
| Monroe | Union, NC | 274 | $400,000 | $427,357 | 37 | $199.03 |
| North Carolina side total | NC | 1,452 | $568,535 | $731,454 | 20 | $237.43 |
| South Carolina side total | SC | 421 | $610,000 | $683,631 | 29 | $230.34 |
| All 13 areas | NC and SC | 1,873 | $575,000 | $720,704 | 22 | $236.32 |
New this month: median price per square foot, which is the fairest way to compare a 2,400 square foot house in Indian Trail against a 4,900 square foot house in Weddington. The spread runs from $193.77 in Indian Trail to $367.63 in SouthPark, close to double.
“Across 13 South Charlotte areas, 1,873 homes closed in the 90 days ending October 1, 2026 at a $575,000 median. Days on market rose in 11 of 13 areas while prices eased about 2 percent, so the opening for buyers this fall is time rather than discount.” Steve Jarrell, The Longleaf Group at eXp Realty, data per Canopy MLS.
Here’s how I’d use this if you’re buying: find your town, read the days on market column before you read price, and notice that almost every number in it got bigger. That is your negotiating room. If you’re selling, the same column is a warning that the summer pricing you heard about from a neighbor in June no longer applies.
Download this window as a CSV · aggregated figures only, published under a CC BY 4.0 license.
What changed in South Charlotte since the September 2026 report
Across the 13 South Charlotte areas, closings fell from 2,158 in the 90 days ending September 1 to 1,873 in the 90 days ending October 1, 2026, down 13.2 percent, with dollar volume down 15.1 percent to $1.35 billion, per Canopy MLS. Both of those are much larger drops than the 3 percent easing between the August and September windows. Price barely followed: the average fell 2.2 percent and the median 2.5 percent.
A 13 percent drop in closings with a 2 percent drop in price tells you something specific. Sellers are not cutting to move inventory. The window simply rolled off the June closings, which came from a strong spring, and picked up September instead. That is seasonal, and it happens every year in this region.
What is worth your attention is the time column. Median days on market rose in Weddington (10 to 12), SouthPark (7 to 10), Ballantyne (10 to 11.5), Waxhaw (17 to 21), Matthews (9 to 14), Fort Mill (19 to 27), Indian Land (24 to 33), Mint Hill (16.5 to 25), Pineville (10 to 13) and Monroe (32.5 to 37). Only Indian Trail (25 to 22) and Lake Wylie (27.5 to 17) got faster, and Lake Wylie is a 25 sale market where one month proves very little.
Matthews and Mint Hill are the two to watch. Matthews went from nine days to fourteen and its average fell 6.3 percent, the steepest in the region. Mint Hill’s average rose 3.6 percent while its median days on market went from 16.5 to 25, which usually means the homes that did sell were the larger ones and the rest sat.
The state line stopped being a discount
There is a good chance someone has told you that you can cross into South Carolina and buy the same house for less. For most of the last year that was roughly true on the median. It is not true in this window.
In the 90 days ending October 1, 2026, per Canopy MLS, the three South Carolina areas, Fort Mill, Indian Land and Lake Wylie, closed 421 homes at a $610,000 median. The ten North Carolina areas closed 1,452 at a $568,535 median. That is a $41,465 gap in favor of North Carolina. A month ago the same comparison was $592,000 against $590,000, a difference of about $2,000.
Fort Mill is the reason. It was the only large area in the region whose average price rose this window, up 1.8 percent to $682,328 on 329 closings, while its median days on market went from 19 to 27. Indian Land sits right behind it at a $575,000 median and the second slowest market in the region at 33 days. Lower South Carolina property taxes still favor the Carolina side on a monthly payment, and that math has not changed. The purchase price advantage, for this window, has.
Price per square foot says the same thing more plainly. South Carolina came in at $230.34 against $237.43 in North Carolina, a difference of about 3 percent. The headline median gap is mostly a question of what kind of house is being built and sold on each side, not of one side being cheaper to live in.
The top of the market got thin: Weddington and Marvin
Weddington stayed the most expensive South Charlotte area we track in the 90 days ending October 1, 2026, at a $1,500,000 median and a $1,611,676 average on 35 closings, per Canopy MLS, with the second highest price per square foot in the region at $328.99. Its average fell 4.6 percent from last month, which on 35 sales means two or three fewer very large closings and little else.
Marvin is the sharper example. Five single family homes closed there in 90 days. That is too small a sample to publish a median or an average without misleading you, so I am not publishing one, the same call I made last month at seven sales. Its five closings stay in the regional totals. For context on the market itself rather than the price, the median days on market across those five was 35.5, up from 10 last window.
Marvin is a village of about 8,000 people that incorporated in 1994 specifically to control its own growth, with a 2.5 acre minimum on most residential lots. A market that small is a feature of how the place was designed, not a signal about the region. I walked through what that means for anyone considering it:
SouthPark’s average is carrying three very large sales
SouthPark (ZIP codes 28210 and 28211, the Charlotte submarket around SouthPark mall) shows a $1,113,641 average against an $806,500 median in the 90 days ending October 1, 2026, per Canopy MLS. That is a $307,141 spread, the widest in the region, and it is the clearest reason to read the median column rather than the average.
Three sales in the window closed above $5 million, at $5,675,000, $5,965,000 and $6,500,000. Strip those three out of 202 closings and the average drops to $1,039,274. Those three homes alone lift the SouthPark average by $74,367.
What SouthPark genuinely leads on is speed and price per square foot. It was the fastest market in the region at a median 10 days, and at $367.63 per square foot it is 56 percent above the regional median of $236.32. If you are comparing SouthPark to Ballantyne, the $806,500 and $720,000 medians are the honest comparison to make, and the per square foot numbers, $367.63 against $281.06, tell you most of what the price difference is buying.
The value corridor is still the slowest market
This is the fourth month in a row the same pattern has held in South Charlotte: the most affordable towns take the longest to sell. Over the 90 days ending October 1, 2026, per Canopy MLS, Monroe, the least expensive area we track at a $400,000 median and a $427,357 average, posted a median 37 days on market, the longest in the region and up from 32.5 last window. Indian Trail sits at 22 days, the only North Carolina area that got faster, with the lowest cost per square foot in the region at $193.77.
For a buyer, that is where the room to negotiate is. A house sitting 37 days is a conversation. A house in SouthPark sitting 10 days is not. For a seller in Monroe or Indian Trail, pricing at the market rather than above it is the entire game, because your competition sits for more than a month and buyers can see that.
One caution before you act on any of this. These are 90 day closed sale statistics, so they describe what already happened rather than what you’re walking into this week, and a 90 day window that just closed always picks up a few more recordings in the weeks after. If you’re deciding on a specific street or a specific subdivision, ask me to pull that submarket instead of leaning on a town wide median.
How to read these numbers
Four rules that will keep you out of trouble with any market table, including this one.
Read the median before the average. The median is the middle sale. The average is pulled by whatever the largest sales happened to be, which is why SouthPark shows a $307,141 gap between the two and Pineville, with no outliers, shows $2,113.
Read days on market before price. Price tells you what the market was. Days on market tells you what it is doing now, and it turns before price does. This window is a clean example: time moved in 11 areas, price moved almost nowhere.
Use price per square foot to compare across towns. A $600,000 median in Fort Mill and a $575,000 median in Matthews look close until you see $231.01 against $234.95 per square foot, which tells you the Fort Mill house is simply bigger.
Discount small samples. Marvin at 5 closings and Lake Wylie at 25 can swing double digits on one unusual sale. Weddington at 35 is thin too. Waxhaw at 261, Fort Mill at 329 and Monroe at 274 are the areas where a month to month change is a real signal.
South Charlotte housing market FAQ
How is the housing market in South Charlotte right now?
Slower, and only slightly cheaper. The 13 areas we track closed 1,873 single family homes in the 90 days ending October 1, 2026, 13.2 percent fewer than the prior window, while the median price eased 2.5 percent to $575,000. The bigger change was time: median days on market rose in 11 of the 13 areas. Buyers have more room to think than they did in the summer.
What is the average home price in South Charlotte?
Across the 13 areas, the average sale price was $720,704 and the median was $575,000 for the 90 days ending October 1, 2026, per Canopy MLS. Town averages ranged from $427,357 in Monroe to $1,611,676 in Weddington. The median is the more useful number, because a handful of very large sales pull the average up.
What is the most expensive town in South Charlotte?
Weddington, at a $1,500,000 median and a $1,611,676 average in the 90 days ending October 1, 2026, per Canopy MLS. SouthPark is the priciest Charlotte submarket we track at an $806,500 median, and it leads the region on price per square foot at $367.63.
Where are the most affordable homes near Charlotte NC?
Monroe, at a $400,000 median and a $427,357 average in the 90 days ending October 1, 2026, per Canopy MLS, followed by Pineville at a $491,250 median and Indian Trail at $502,023. Indian Trail is the lowest cost per square foot in the region at $193.77, and Monroe gives buyers the most negotiating time at a median 37 days on market.
Is the Charlotte housing market slowing down?
On the south side, yes, in volume and in speed more than in price, over the 90 days ending October 1, 2026, per Canopy MLS. Closings fell 13.2 percent and dollar volume fell 15.1 percent against the prior 90 day window, and days on market rose in 11 of 13 areas, while the average price slipped 2.2 percent and the median 2.5 percent. That pattern reads as the usual post-summer cooldown rather than a price correction.
How long does it take to sell a house in South Charlotte?
It depends heavily on the town. Median days on market for the 90 days ending October 1, 2026: 10 in SouthPark, 11.5 in Ballantyne, 12 in Weddington, 13 in Pineville, 14 in Matthews, 17 in Lake Wylie, 21 in Waxhaw, 22 in Indian Trail, 25 in Mint Hill, 27 in Fort Mill, 33 in Indian Land, and 37 in Monroe.
Is it cheaper to buy in South Carolina or North Carolina near Charlotte?
Not any more, on the median. In the 90 days ending October 1, 2026, per Canopy MLS, the three South Carolina areas we track, Fort Mill, Indian Land and Lake Wylie, posted a $610,000 median against $568,535 on the North Carolina side, a $41,465 gap. A month ago that gap was about $2,000. The South Carolina side is also the slower one, at a 29 day median against 20 days in North Carolina.
How many homes sold in South Charlotte recently?
1,873 single family homes closed across the 13 tracked areas in the 90 days ending October 1, 2026: 1,452 on the North Carolina side and 421 in the South Carolina border towns of Fort Mill, Indian Land and Lake Wylie.
Where does this market data come from?
From Canopy MLS, the multiple listing service covering the Charlotte region, accessed through the Matrix platform under a broker license. Closed sales only: not list prices, not pending sales, not automated estimates. The numbers cover single family homes only and are republished monthly with the prior edition preserved as a dated snapshot.
About the Author
Steve Jarrell is a licensed North Carolina and South Carolina broker and the team lead of The Longleaf Group at eXp Realty, which he co-leads with his wife Amanda. Before real estate, Steve joined VisualTour as President, led its rebrand to Paradym, and led the company to its acquisition by Constellation Software in 2020. He holds an MBA from the University of Tennessee with concentrations in Marketing and Innovation. The Longleaf Group is an eXp ICON Team and a RealTrends Verified Top Team by Volume for 2026, with 140+ five-star reviews.
He lives in Weddington, works both sides of the state line every week, and publishes this report monthly from Canopy MLS data rather than from a portal estimate. He also runs the Living in South Charlotte YouTube channel.
Which South Charlotte Town Is Right for You?
The table tells you what towns cost and how long they take. It cannot tell you which one fits how you actually live. That conversation takes about twenty minutes.
704-774-7170 · steve@jarrellhomes.com · thelongleafgroup.com